Visualizing Makefiles
16 Sep 2015I use Makefiles to make reproducibility easier. They can become rather complex. I lately had the idea that it would be nice to be able to visualize my Makefiles. Turns out that you need just a few lines in R to get a decent graph. I figured this would make a nice first blog entry. The code is not super-nice yet and will probably not work for more complex Makefiles, but you can write me if you have ideas. And when I have time again, I will implement something for more complex Makefiles.
So here is the code and the visualisation of one of my Makefiles:
library(tm)
library(igraph)

## Read makefile into R
makefile <- readLines("Makefile")


## Find relevant lines in makefile
dep <- grep(":", makefile, value = TRUE)

## Select target files
target <- gsub(":.*", "", dep)

## Select files target depends on
depends <- gsub(".*:", "", dep)
depends <- strsplit(depends, " ")
names(depends) <- target


## Create a dependency matrix (using igraph package)
dlist <- lapply(target, function(t) {
  d <- if(length(depends[[t]]) == 0) NA else depends[[t]]
  data.frame(depends = d, target = t)
  })
dependencymat <- na.omit(do.call("rbind", dlist))
dependencymat <- dependencymat[dependencymat$depends != "", ]
makegraph <- graph.data.frame(dependencymat)

## ... and plot
plot(makegraph, vertex.shape = "none", edge.arrow.size = 0.5)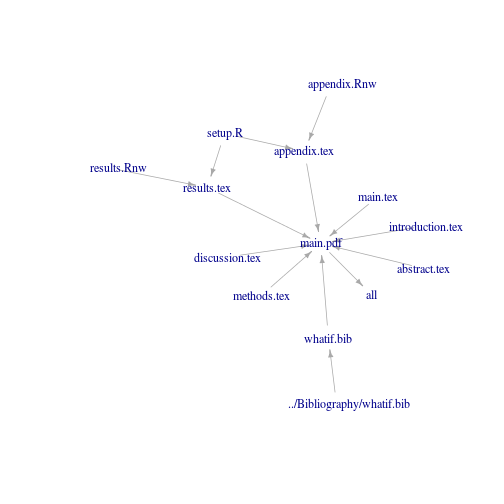
Have fun using it!